Bitcoin, Ethereum, Ripple – Bulls set sights on $120K BTC, $3K ETH, and $3 XRP
- Bitcoin stabilizes near $111,500, with bullish momentum building toward the $120,000 target.
- Ethereum continues its recovery, hovering around $2,700 after bouncing from key support levels earlier in the week.
- Ripple holds above the 50-day EMA at $2.30, signaling potential for a push toward the $3 psychological level.
Bitcoin (BTC), Ethereum (ETH) and Ripple (XRP) continue to show signs of strength heading into the weekend, with bullish sentiment lifting prices. BTC is holding steady above $111,000 as traders eye the long-awaited $120,000 milestone. Meanwhile, ETH and XRP prices found support at their key levels, suggesting the uptrend may carry ETH toward $3,000 and XRP toward $3.
Bitcoin bulls gain momentum, targeting the $120K mark
Bitcoin’s price rallied and broke above its all-time high of $109,588 on Wednesday. It continued its rise, setting a new ATH of $111,980 the next day. At the time of writing on Friday, it stabilizes at around $111,000.
BTC enters a price discovery mode: if it continues its upward trend, it could extend the rally toward a key psychological level of $120,000.
The Relative Strength Index (RSI) on the daily chart reads 76, above its overbought level of 70, indicating strong bullish momentum. However, traders should be cautious as the chances of a pullback are high due to its overbought condition. Meanwhile, the Moving Average Convergence Divergence (MACD) indicator also showed a bullish crossover on Wednesday, giving buy signals and indicating an upward trend.
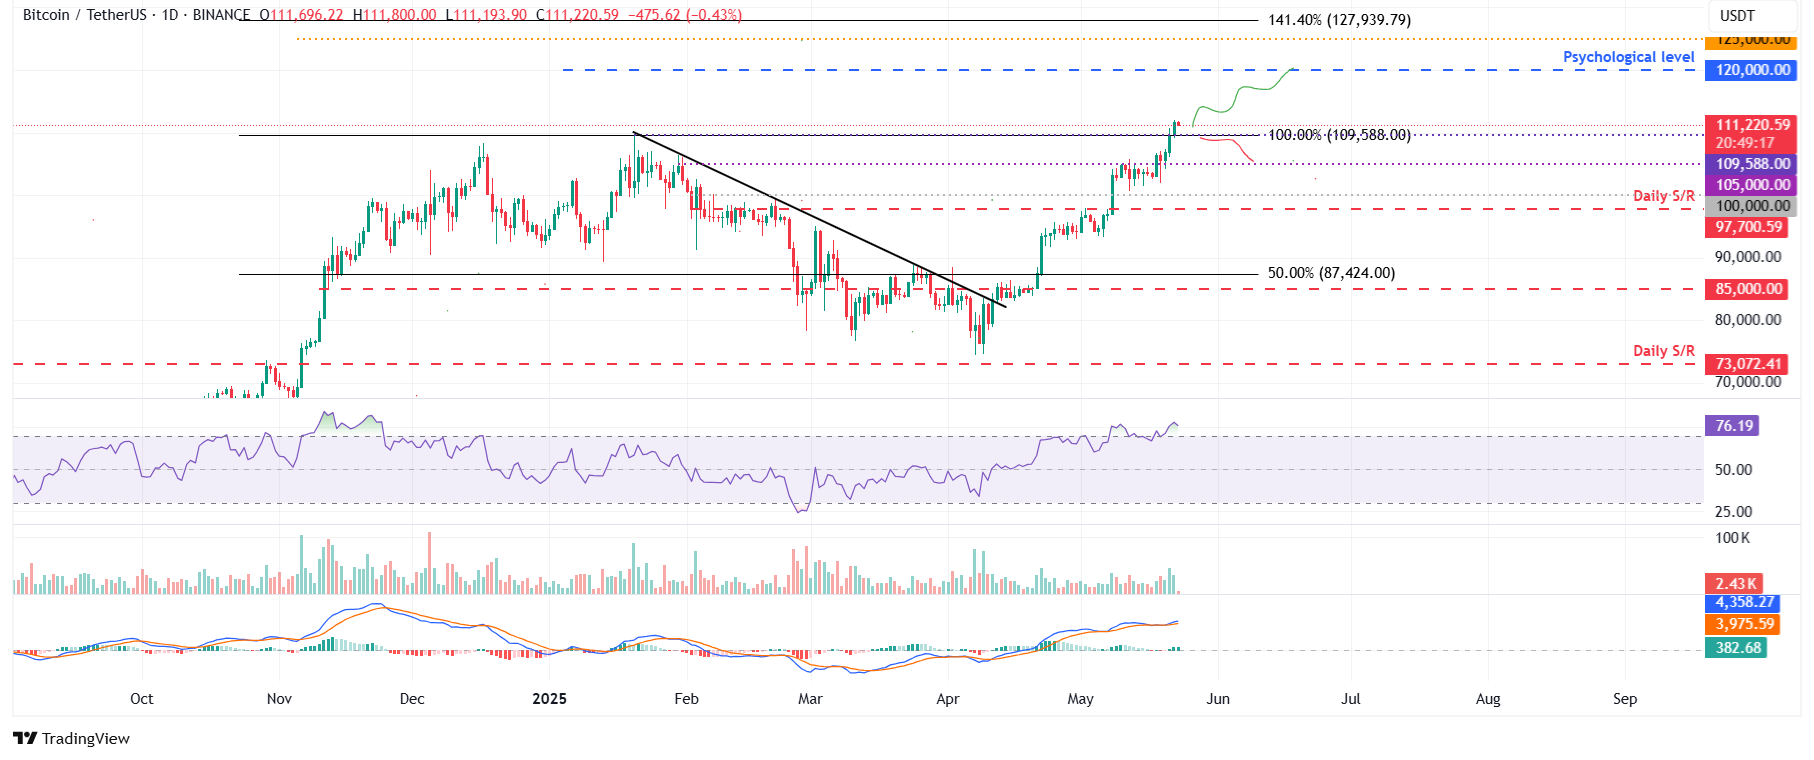
BTC/USDT daily chart
If BTC faces a pullback, it could extend the correction to retest its key support at $105,000.
Ethereum aims for the $3,000 mark as it rebounds from the 200-day EMA support
Ethereum price has retested and found support around its 200-day Exponential Moving Average (EMA) at around $2,446 since last week. On Wednesday, it recovered nearly 5% by the next day. At the time of writing on Friday, it continues to trade higher at around $2,700.
If ETH continues its upward trend, it could extend the rally to retest its key psychological level at $3,000.
The RSI on the daily chart reads 74, above its overbought level of 70, indicating strong bullish momentum. However, traders should be cautious as the chances of a pullback are high due to its overbought condition. Meanwhile, the MACD indicator also showed a bullish crossover on Thursday, giving buy signals and indicating an upward trend.
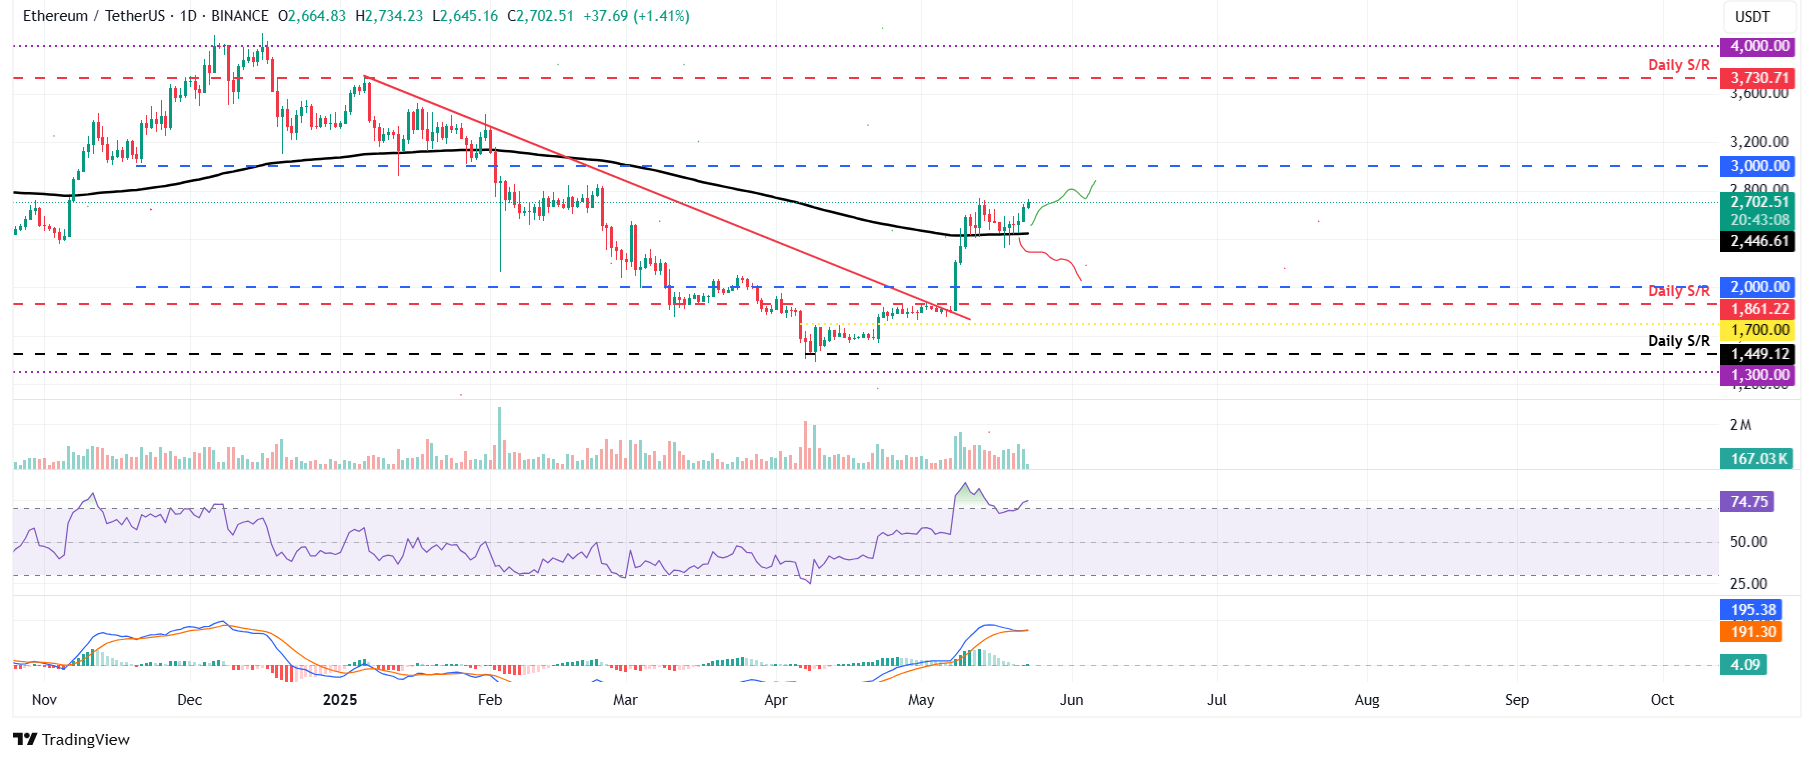
ETH/USDT daily chart
On the other hand, if ETH declines and closes below its 200-day EMA at $2,446, it could extend the decline to retest its key psychological level at $2,000.
XRP holds strong at its 50-day EMA
XRP price rebounded after retesting its 50-day EMA at $2.30 last week and recovered slightly.
However, as of this week, it again declined and rebounded from this level, recovering 3%. On Friday, it continues to recover, trading at around $2.46.
If XRP continues to recover, it could extend the recovery to retest its next resistance at $2.72 before heading toward the $3 mark.
The RSI on the daily chart reads 58, above its neutral level of 50 and pointing upward, indicating bullish momentum. The MACD indicator is also about to flip a bullish crossover. It could further support the bullish thesis if it successfully completes a bullish crossover.
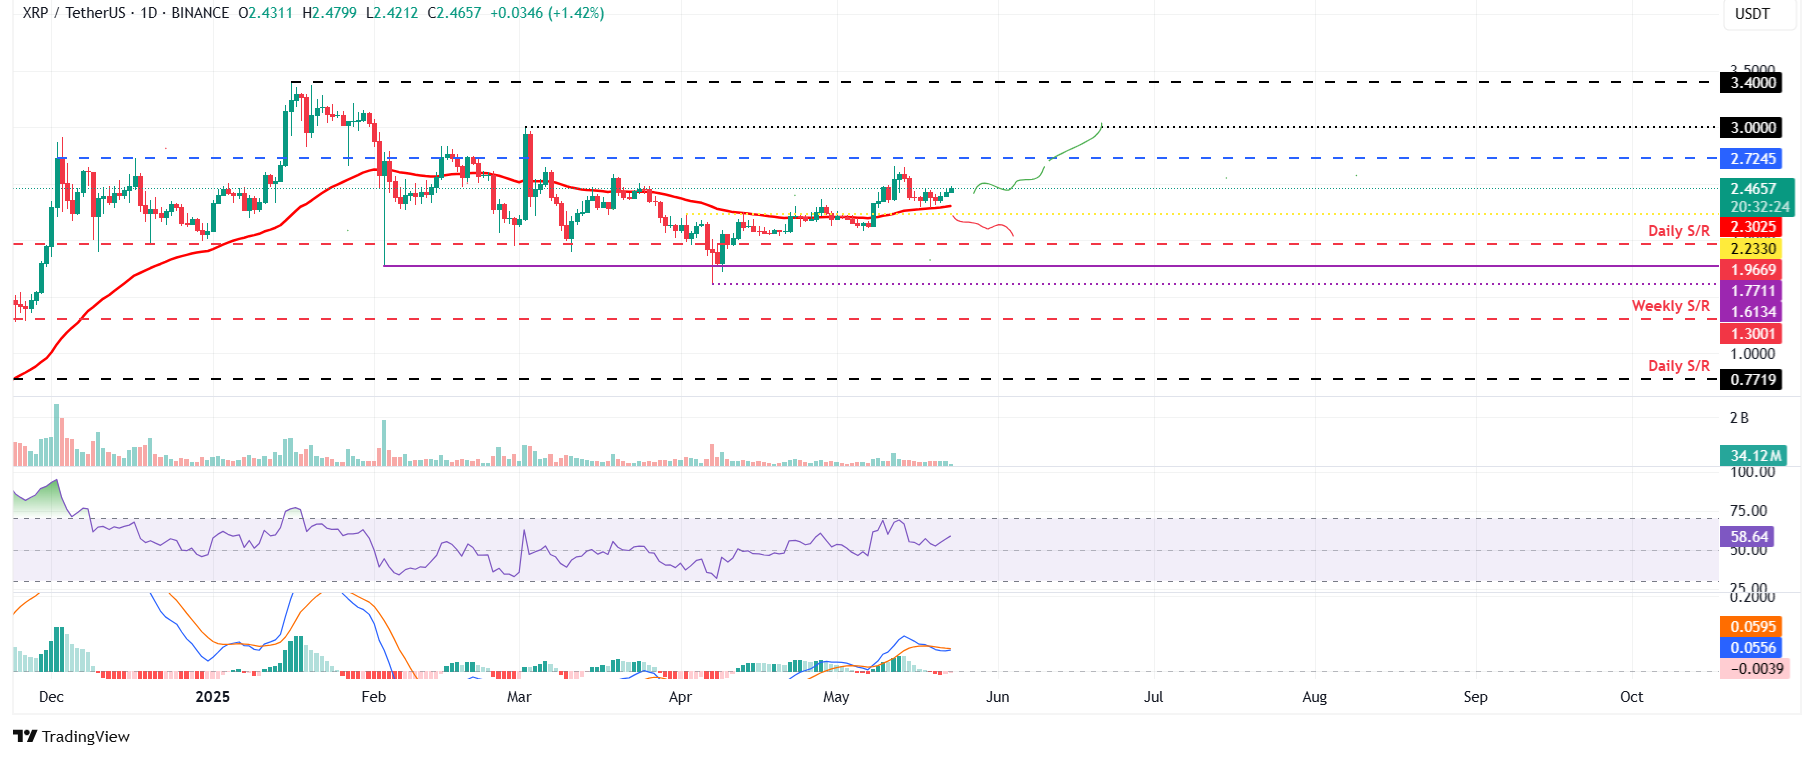
XRP/USDT daily chart
If XRP breaks and closes below its 50-day EMA on a daily basis, it could extend the correction toward its next key support at $2.23.