- EUR/JPY reached the 11-month high at 168.64 on Monday.
- The 14-day RSI is above the 70 level, signaling overbought conditions and suggesting a potential near-term pullback.
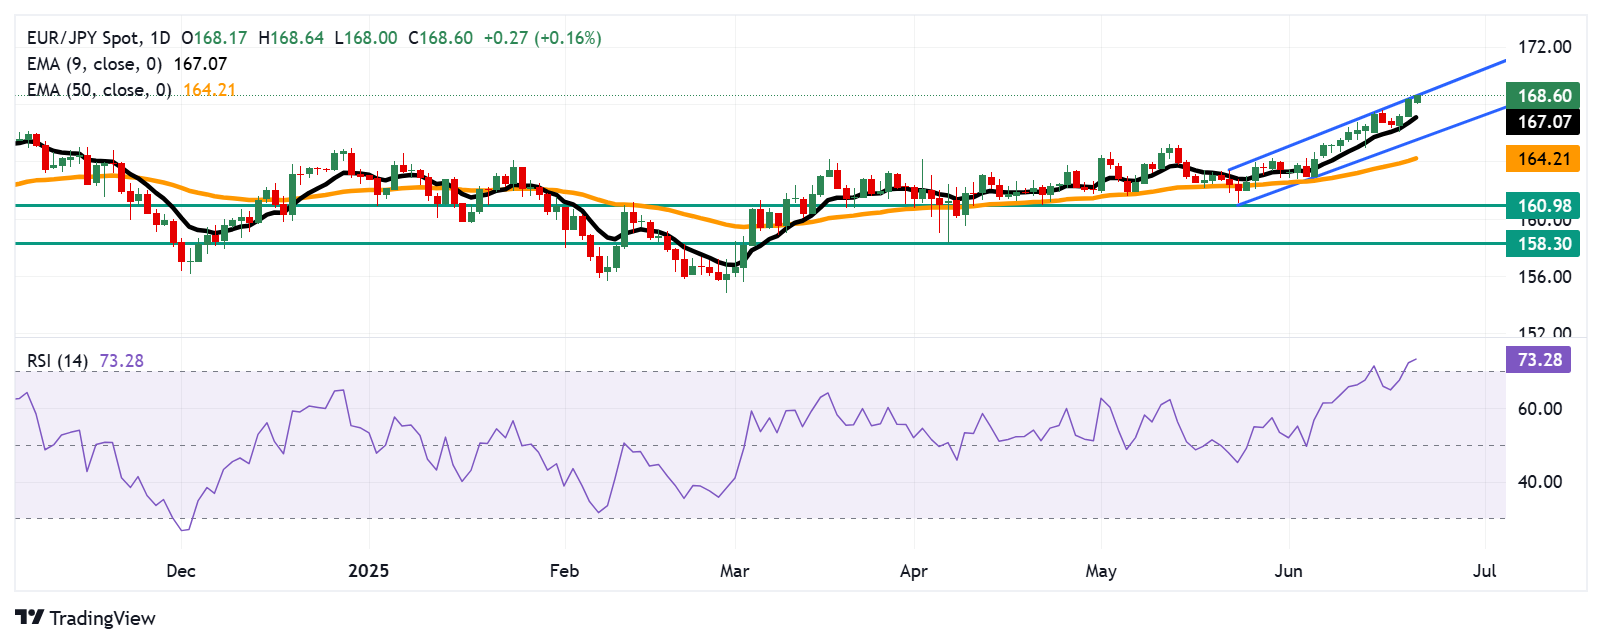
- The initial support appears at the nine-day EMA of 167.07.
EUR/JPY extends gains for the third successive session, trading around 168.70 during the Asian hours on Monday. According to the technical analysis of the daily chart, the currency cross moves upwards within an ascending channel pattern, suggesting the strengthening of a bullish bias.
However, the EUR/JPY cross rises above the nine-day Exponential Moving Average (EMA), signaling short-term momentum is stronger. However, the 14-day Relative Strength Index (RSI) is positioned above the 70 mark, suggesting an overbought situation and a potential downward correction soon.
On the upside, the EUR/JPY cross is testing the upper boundary of the ascending channel around 168.80, followed by the psychological level of 169.00. A break above the crucial resistance channel would strengthen the bullish bias and lead the currency cross to approach the 170.00 level.
The EUR/JPY cross could find initial support at the nine-day EMA of 167.07. A break below this level would weaken the short-term price momentum and put downward pressure on the currency cross to test the ascending channel’s lower boundary around 165.60. Further support appears at the 50-day EMA at 164.21.
EUR/JPY: Daily Chart
Euro PRICE Today
The table below shows the percentage change of Euro (EUR) against listed major currencies today. Euro was the strongest against the New Zealand Dollar.
| USD | EUR | GBP | JPY | CAD | AUD | NZD | CHF | |
|---|---|---|---|---|---|---|---|---|
| USD | -0.30% | -0.11% | 0.09% | 0.06% | 0.35% | 0.38% | 0.07% | |
| EUR | 0.30% | 0.16% | 0.44% | 0.36% | 0.61% | 0.69% | 0.33% | |
| GBP | 0.11% | -0.16% | 0.32% | 0.20% | 0.45% | 0.53% | 0.17% | |
| JPY | -0.09% | -0.44% | -0.32% | -0.06% | 0.22% | 0.34% | -0.11% | |
| CAD | -0.06% | -0.36% | -0.20% | 0.06% | 0.33% | 0.32% | -0.03% | |
| AUD | -0.35% | -0.61% | -0.45% | -0.22% | -0.33% | 0.06% | -0.28% | |
| NZD | -0.38% | -0.69% | -0.53% | -0.34% | -0.32% | -0.06% | -0.35% | |
| CHF | -0.07% | -0.33% | -0.17% | 0.11% | 0.03% | 0.28% | 0.35% |
The heat map shows percentage changes of major currencies against each other. The base currency is picked from the left column, while the quote currency is picked from the top row. For example, if you pick the Euro from the left column and move along the horizontal line to the US Dollar, the percentage change displayed in the box will represent EUR (base)/USD (quote).