Mexican Peso climbs to eight-month highs against the US Dollar despite upbeat US jobs data
- The Mexican Peso extends its gains against the US Dollar as markets adopt a ‘risk-on’ sentiment following the easing of US-China tensions.
- USD/MXN remains in a short-term bearish trend below 19.20.
- US-Mexico tensions remain in focus next week as Mexico condemns 50% tariffs on steel and aluminium imports to the US.
The Mexican Peso (MXN) is experiencing its third consecutive day of gains against the US Dollar (USD) on Friday, pushing the USD/MXN exchange rate to its lowest level in eight months.
With the emerging market pair trading near the October low of 19.11, bearish momentum of the short-term trend continues to hold. The pair momentarily traded at 19.09, its lowest level since mid-September.
Throughout the week, escalating trade tensions and a weaker USD have underpinned MXN strength. However, Thursday’s diplomatic developments and Friday’s better-than-expected US employment data have added complexity to the broader narrative.
The latest move in USD/MXN reflects a combination of strong domestic fundamentals in Mexico, including rising consumer confidence and resilient exports, alongside global risk appetite and fading expectations of an imminent Federal Reserve (Fed) rate cut. The pair remains vulnerable to further downside if tariff tensions escalate or if the Mexican government fails to secure an exemption from the recently imposed US steel and aluminum tariffs.
Mexican Peso daily digest: USD/MXN weighs tariffs, growth outlook, and consumer confidence
- Mexico’s Economy Minister Marcelo Ebrard is in Washington to meet with US officials and request an exemption from the recently imposed 50% tariffs on steel and aluminum imports. The Mexican government is pushing hard to protect its industries and jobs, and if no exemption is granted, it plans to announce its response next week.
- Friday’s US Nonfarm Payrolls (NFP) report for May surprised to the upside. The US economy added 139,000 new jobs, beating analysts’ expectations of a 130,000 increase. Meanwhile, the Unemployment Rate remained unchanged at 4.2%.
- The stronger-than-expected headline figure has provided temporary relief for the Dollar, easing concerns that the Federal Reserve may need to act quickly with rate cuts.
- According to the CME FedWatch Tool, the probability of a July rate cut has dropped sharply to 16.5%, down from 33.9% prior to the release. The data has temporarily eased pressure on the Fed to act swiftly, suggesting that policymakers may adopt a more patient stance in the near term.
- On Thursday, Mexico’s Consumer Confidence data for May was released, showing a figure of 46.5, an increase from 45.5 in April. On Thursday, Reuters reported that the Canadian Prime Minister called US tariffs “illegal,” while Mexico and the European Union expressed similar frustration.
- On Wednesday, Mexican President Claudia Sheinbaum called the new tariffs “unjust, unsustainable, and without legal grounds,” warning that if a deal is not reached, Mexico will be forced to respond with retaliatory measures. Canada and the EU have also threatened to retaliate if no progress is made in trade talks.
USD/MXN technical analysis: Bearish trend remains strong below 19.20
Price action on the USD/MXN daily chart continues to reinforce the broader bearish structure. With prices currently trading around the October low of 19.11, the psychological level of 19.20 is providing an important barrier of resistance for the short-term move.
At the time of writing, prices remain below both the 10-day Simple Moving Average (SMA) at 19.26 and the 20-day SMA at 19.33. The 78.6% Fibonacci retracement level at 19.57, derived from the broader October–February rally, now acts as a key resistance level, further capping any recovery attempts.
The Relative Strength Index (RSI) near 36 signals bearish momentum, although the indicator has yet to reach oversold conditions, suggesting potential for further downside.
USD/MXN daily chart
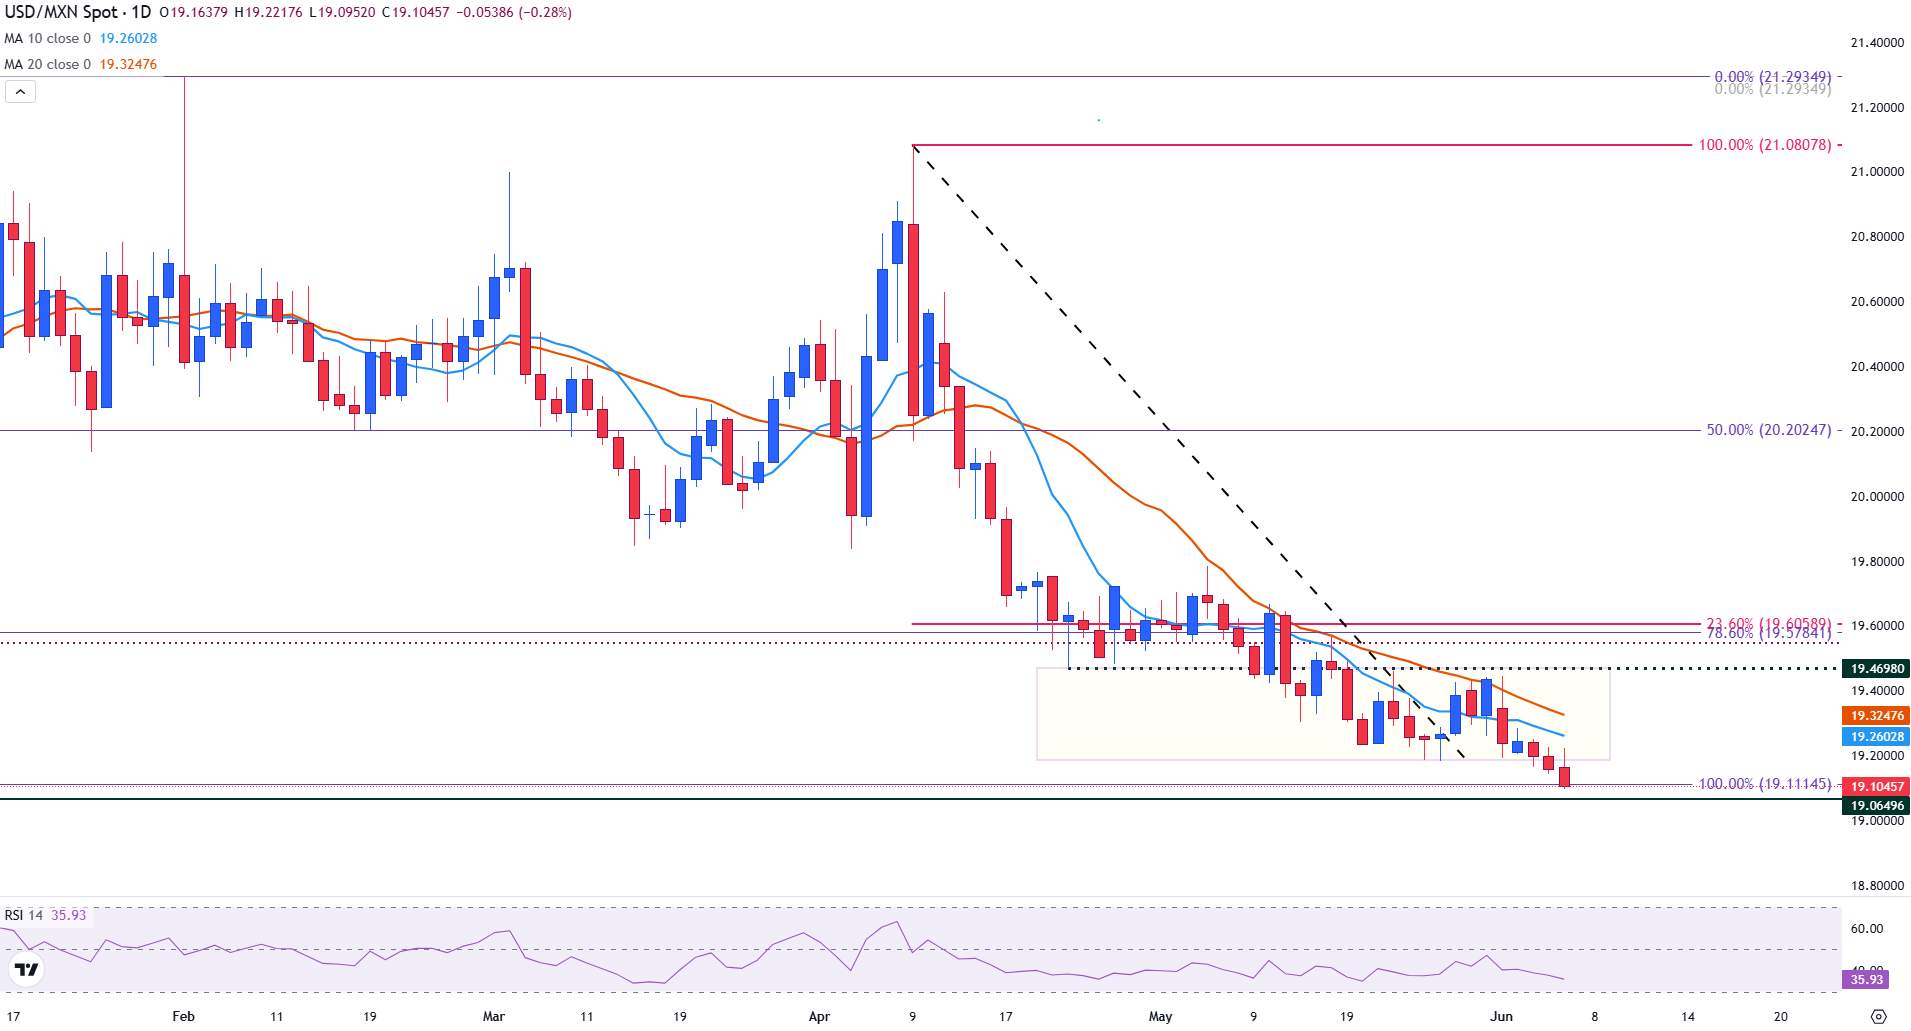
From here, the bearish scenario would involve a decisive break below the October low of 19.11, which could see prices retest the September low of 19.07, opening the door for bearish continuation toward 19.00
On the other hand, the bullish scenario would require a sustained recovery above 19.28 (10-day SMA) and 19.34 (20-day SMA), followed by a breakout above the 19.60 resistance, which aligns with the 23.6% retracement of the same October–February move.