- NZD/USD slumps to near 0.5900 as the US Dollar capitalizes on upbeat US S&P Global PMI data for May.
- The US Composite PMI increased to 52.1 from 50.6 in April.
- Trump’s tax bill is expected to accelerate fiscal imbalances.
The NZD/USD pair falls to near the round level of 0.5900 during North American trading hours on Thursday. The Kiwi pair slumps after the release of the stronger-than-projected United States (US) Purchasing Managers’ Index (PMI) data for May.
The PMI report showed that the overall business activity in the private sector expanded at a robust pace, with a meaningful increase in output in both the manufacturing and the services sectors. The Composite PMI came in significantly higher at 52.1 from 50.6 in April.
Upbeat US PMI data led to a sharp increase in the demand for the US Dollar (USD), with the US Dollar Index (DXY) rising to near 99.90.
Meanwhile, the outlook of the US Dollar remains uncertain as the approval of President Donald Trump’s new tax bill in the House of Representatives is expected to escalate fiscal imbalances.
On the Kiwi front, New Zealand (NZ) Trade balance data for April has come in surprisingly stronger than projected. On month, the Trade Surplus came in at 1.43K million New Zealand Dollars (NZD), higher than 794 million NZD and estimates of 0.5K million NZD.
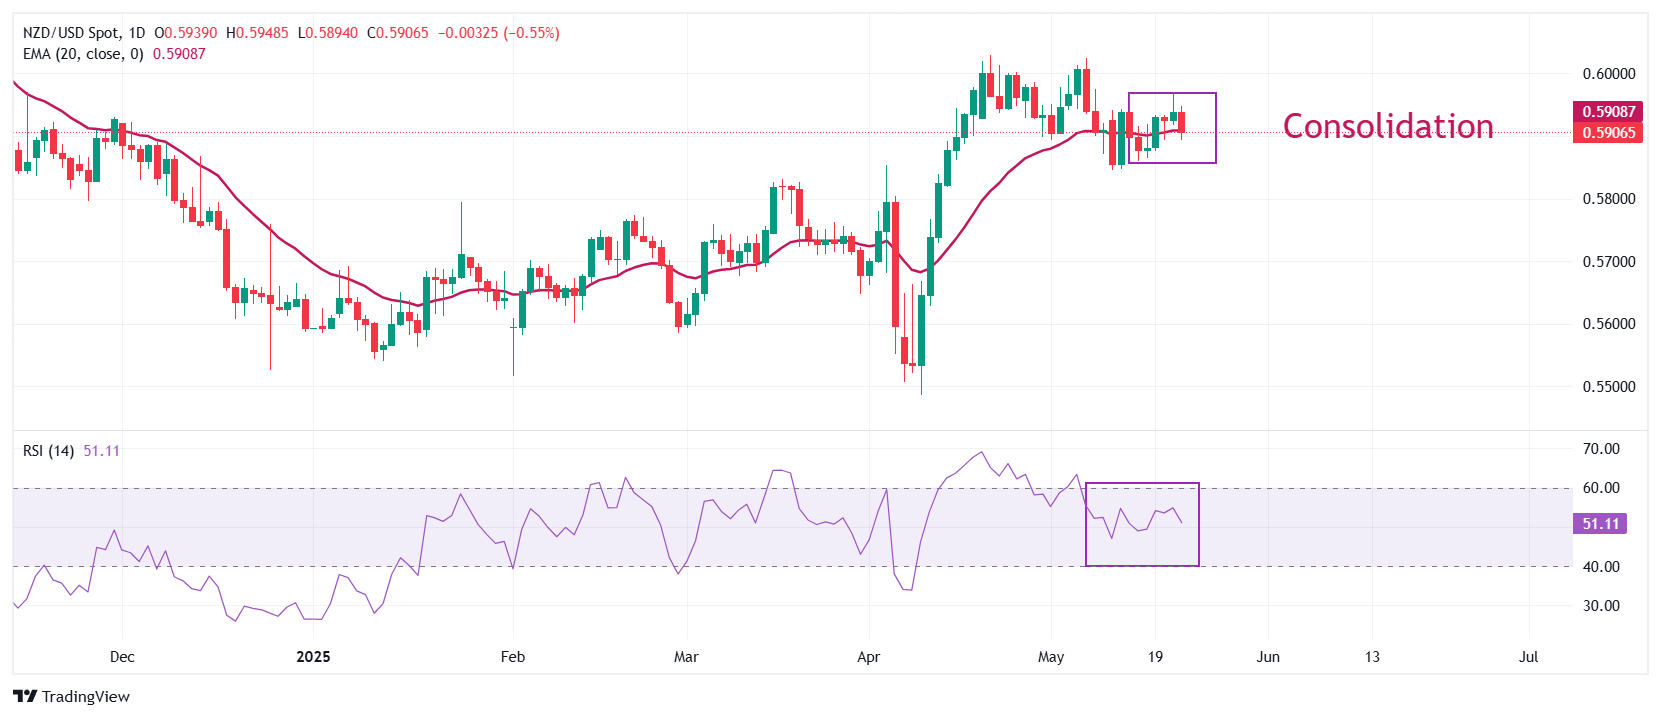
NZD/USD consolidates in a tight range between 0.5860 and 0.5968 for over a week. The pair wobbles around the 20-day Exponential Moving Average (EMA), indicating a sideways trend.
The 14-day Relative Strength Index (RSI) oscillates inside the 40.00-60.00 range, suggesting a sharp volatility contraction.
A downside move towards the April 4 high of 0.5803 and the April 11 low of 0.5730 would be feasible if the pair extends its downside below the 200-day EMA of 0.5860.
In an alternate scenario, an upside move towards the October 9 low of 0.6052 and the round level of 0.6100 can be counted if the pair breaks above the psychological level of 0.6000.
NZD/USD daily chart