Silver is catching up with the gold price. It is playing catch up with the yellow metal, as you can see below. The chart shows the gold and silver prices, which has been normalized to show how they move together over the last 12 months. As youi can see, gold has outperformed silver, but the pace of gain in silver is rising rapidly, while the pace of gain in gold is slowing.
The market’s recent preference for gold has played out in the June price action. The silver price has risen by 10% so far in June, vs, a 1% gain for gold. On a YTD basis, the gold price is higher by 26% and the silver price is higher by 25%. Silver is one of the top performers in the commodity space so far this year, and it is also significantly outperforming US stock indices, and some major European indices.
So, why the silver rush? Below we list some of the reasons why silver is in vogue right now.
- The silver price is at its highest level since 2012. While silver and gold are both benefitting from demand for safe havens right now, silver is not just following gold, it is carving its own nice. Flows into silver ETFs are soaring right now, they rose by 1.5% last week, which is the strongest inflow since February. Flows into silver ETFs outpaced gains for gold ETFs.
- The rush into silver has pushed the gold/ silver ratio back to historic norms (see chart 2 below). This is a sign that the gold price had gone too far too fast. The world wants to hold haven assets right now and silver looks like better value.
- Silver is also some way away from its record high of nearly $50 per ounce, from back in 2011. This suggests that silver could have more room to run.
- Silver also has a strong correlation with gold. This is hardly surprising, but it does suggest that the recent rise in gold could be a sign that investors are trying to
- push silver into record high territory, similar to what the market did with gold earlier this year.
- A stronger outlook for global growth and US growth, which is defying tariff risks, also benefits silver more than gold since there are more industrial uses for silver compared to gold, and industrial demand tends to rise during the summer months.
Chart 1: Gold and silver, normalized to show how they move together over 12 months.
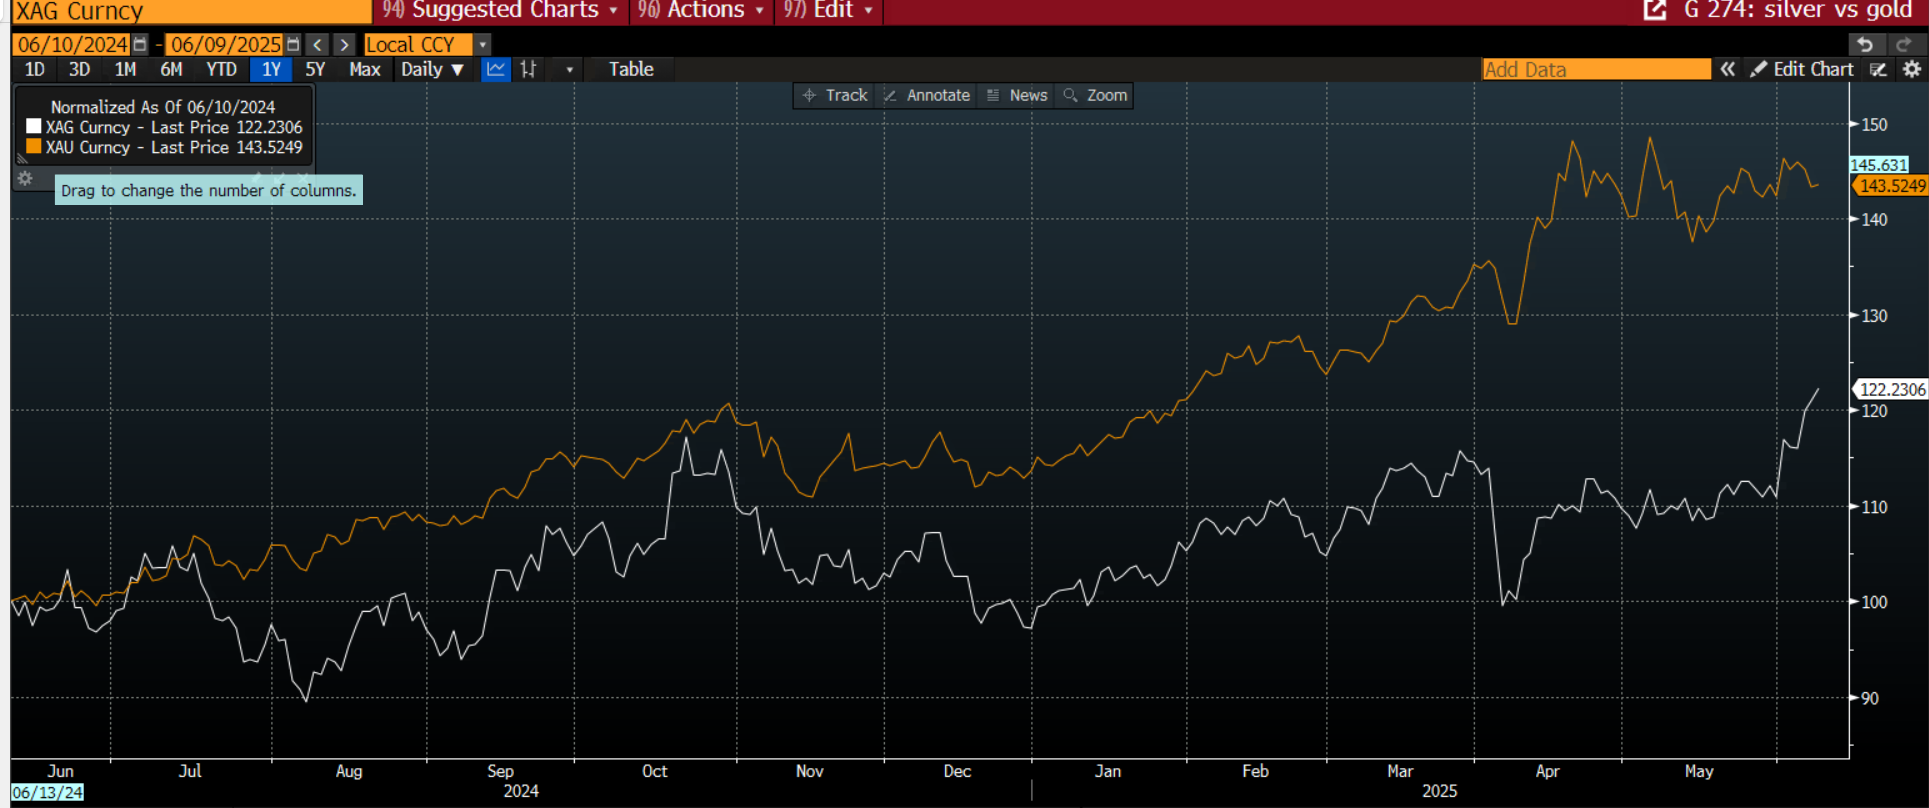
Source: XTB and Bloomberg
Chart 2: Gold/ silver ratio.
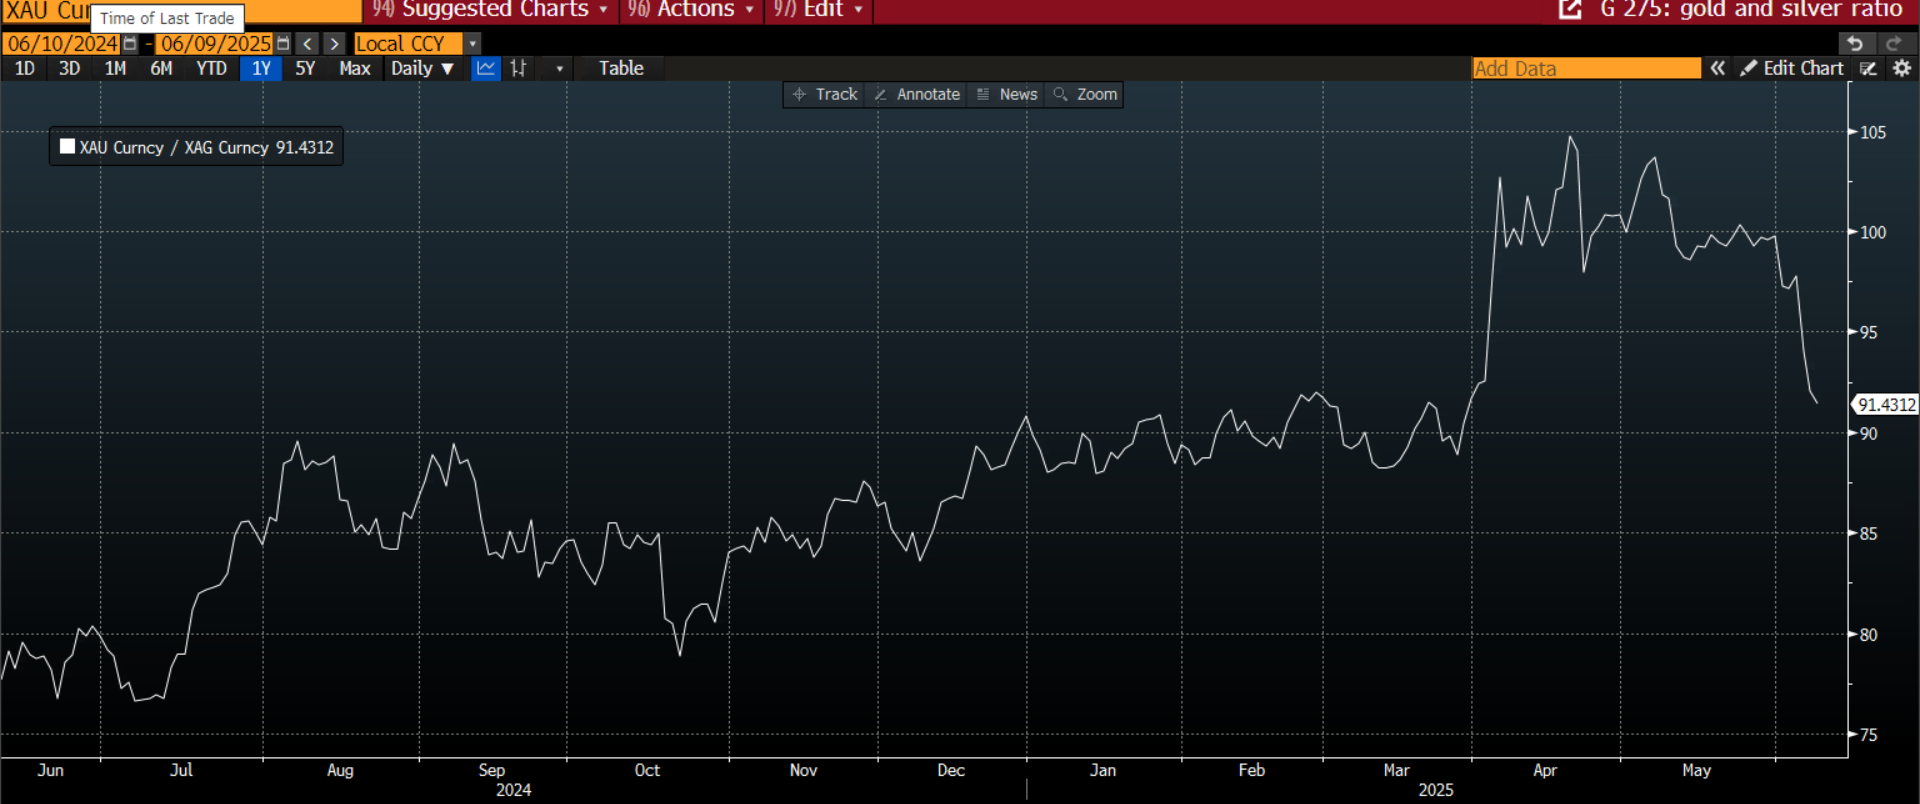
Source: XTB and Bloomberg
The material on this page does not constitute financial advice and does not take into account your level of understanding, investment objectives, financial situation or any other specific needs. All information provided, including opinions, market research, mathematical results and technical analyzes published on the Website or transmitted To you by other means, it is provided for information purposes only and should in no way be construed as an offer or solicitation for a transaction in any financial instrument, nor should the information provided be construed as advice of a legal or financial nature on which any investment decisions you make should be based exclusively To your level of understanding, investment objectives, financial situation, or other specific needs, any decision to act on the information published on the Website or sent to you by other means is entirely at your own risk if you In doubt or unsure about your understanding of a particular product, instrument, service or transaction, you should seek professional or legal advice before trading. Investing in CFDs carries a high level of risk, as they are leveraged products and have small movements Often the market can result in much larger movements in the value of your investment, and this can work against you or in your favor. Please ensure you fully understand the risks involved, taking into account investments objectives and level of experience, before trading and, if necessary, seek independent advice.