TSLA Technical Analysis: The Support Was Tested After Sharp Decline
- Crucial insights into Tesla’s stock (ticker: TSLA) as it tests a critical support zone after a significant drop. Learn about potential bullish and bearish scenarios for traders and investors to consider.
TSLA Technical Analysis: Crucial Support Zone Tested After Sharp Decline
Tesla (TSLA) shares have seen substantial volatility recently, experiencing a sharp decline, notably falling over 14% on Thursday alone. This significant drop erased approximately $152 billion from the company’s market capitalization, marking an intense sell-off session highlighted by record-setting options trading volume.
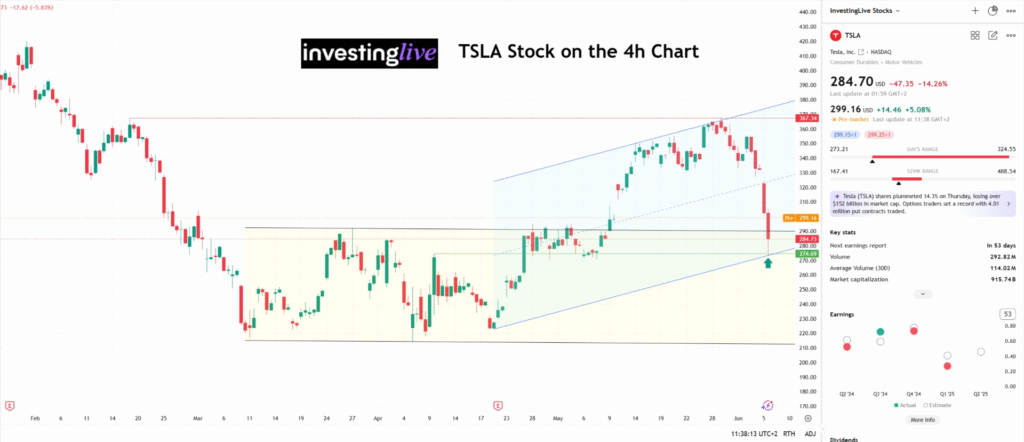
TSLA technical analysis on the 4h stock price chart
Key Levels and Technical Insights:
- Critical Support Zone:
- Tesla stock was currently testing a significant support area between $274 and $280.
- This region has historically acted as a robust demand zone, presenting potential buying opportunities if the support holds.
- But profit takers may be waiting at $311-$314 (not shown in the above chart, but heads up!)
- Ascending Channel:
- Price action has been trading within a clear ascending channel since early April.
- The current pullback aligns with the lower boundary of this channel, suggesting a possible rebound or at least a short-term consolidation at these levels.
- Immediate Resistance:
- $300 is a psychological round-number level that previously served as a pivotal zone for buyers and sellers.
Market Sentiment and Potential Scenarios:
- Bullish Scenario:
- If Tesla shares firmly hold and bounce off the identified support ($274-$280), traders could target a recovery towards the $311area, but it won’t be surprising if the price “dances” around the $300 key round number. Traders that will go Long or Short too close to $300 should consider that they are exposed to being taken out.
- Continuation above $300 would strengthen bullish confidence and potentially drive the stock towards recent highs near $311-$314. If prices crosses up that resistance zone, then, with a bit of patience, $330 is later open for business
- Bearish Scenario:
- A decisive break and sustained close below the $274 support could signal deeper bearish pressure. That would be a breakout down and activation of the bear flag shown in the above stock price chart.
- Traders should consider taking partial profits as price can range between $291.50 and $305.25. That also means that if you are in Long, you can consider taking PARTIAL PROFIT at least, just under $305.25 and if you are shorting TSLA stock, consider covering some of your short just above $291.50
Trading Considerations for TSLA stock investors and traders:
Investors and traders should carefully watch price action around the current key support zone. Volume dynamics and the pace of recovery (or lack thereof) could provide critical insights for near-term trading strategies.
As always, maintain prudent risk management, closely monitor price confirmations, and be mindful of volatility spikes, especially following major moves such as Thursday’s sell-off.