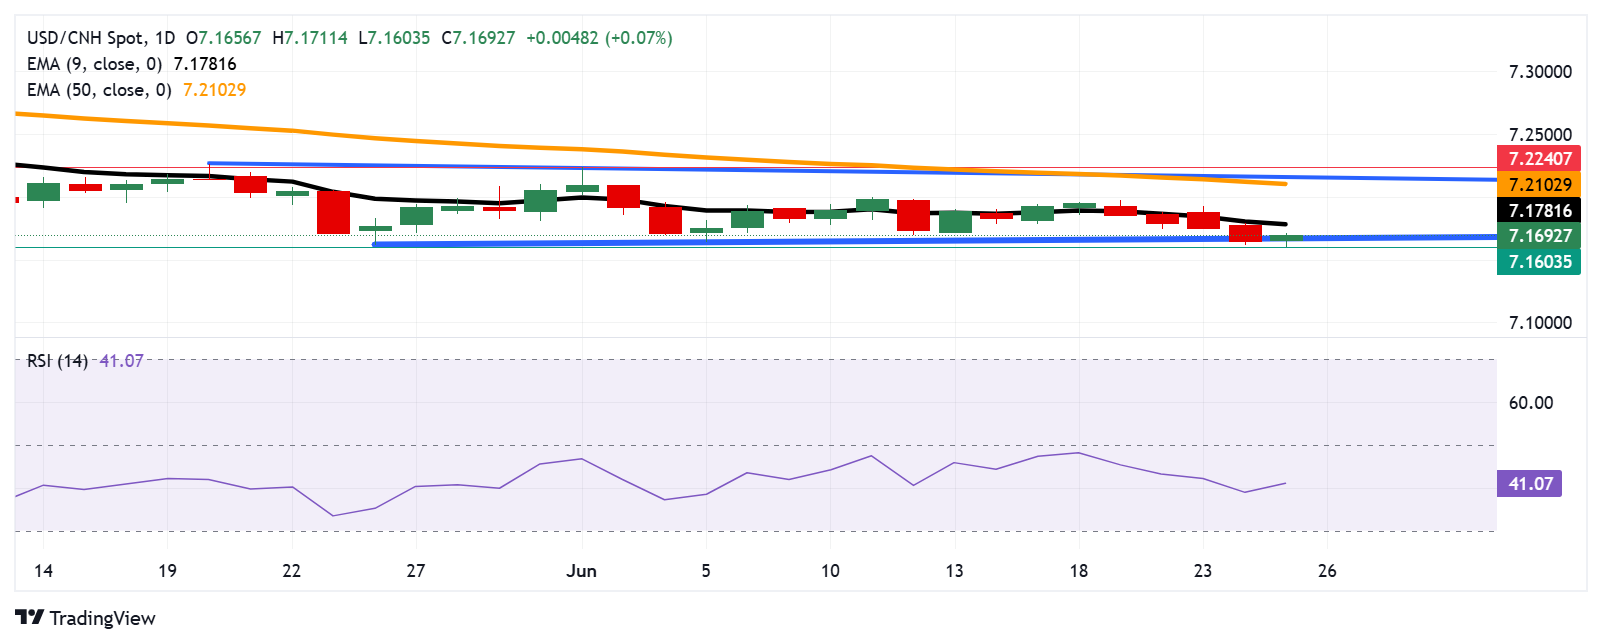
USD/CNH tests the immediate support at the lower boundary of the rectangle around 168.80.
The 14-day Relative Strength Index remains below the 50 level, indicating a prevailing bearish bias.
The primary support appears at the nine-day EMA at 7.1781.
The USD/CNH pair halts its four-day winning streak, trading around 7.1690 during the Asian hours on Wednesday. An analysis of the daily chart indicates that the pair moves sideways within a rectangular pattern, which points to a consolidation phase.However, the 14-day Relative Strength Index (RSI), a key momentum indicator, remains below the 50 level, suggesting a bearish momentum is in play. Additionally, the USD/CNH pair trades below the nine-day Exponential Moving Average (EMA), further suggesting weaker short-term price momentum.On the downside, the USD/CNH pair hovers around the lower boundary of the rectangle around 168.80. A break below this level could confirm the ongoing bearish bias and put the downward pressure on the pair to retest the seven-month low at 7.1603, which was recorded on June 25.The nine-day EMA at 7.1781 appears as the initial barrier. A successful breach above this level would improve the short-term price momentum and support the pair to explore the region around the 50-day EMA at 7.2102, followed by the rectangle’s upper boundary around 7.2150. Further resistance appears at the monthly high of 7.2240, reached on June 2.
To provide the best experiences, we use technologies like cookies to store and/or access device information. Consenting to these technologies will allow us to process data such as browsing behavior or unique IDs on this site. Not consenting or withdrawing consent, may adversely affect certain features and functions.
Functional
Always active
The technical storage or access is strictly necessary for the legitimate purpose of enabling the use of a specific service explicitly requested by the subscriber or user, or for the sole purpose of carrying out the transmission of a communication over an electronic communications network.
Preferences
The technical storage or access is necessary for the legitimate purpose of storing preferences that are not requested by the subscriber or user.
Statistics
The technical storage or access that is used exclusively for statistical purposes.The technical storage or access that is used exclusively for anonymous statistical purposes. Without a subpoena, voluntary compliance on the part of your Internet Service Provider, or additional records from a third party, information stored or retrieved for this purpose alone cannot usually be used to identify you.
Marketing
The technical storage or access is required to create user profiles to send advertising, or to track the user on a website or across several websites for similar marketing purposes.