- USD/JPY gains temporary ground near 145.00 as the US Dollar recoups initial gains.
- The Japanese economy contracted by 0.2% in the first quarter of the year.
- Investors await the flash US Michigan survey data for May.
The USD/JPY pair recoups some of its initial losses and rebounds to near 145.50 during North American trading hours on Friday, while it is still 0.1% down. The pair recovers as the US Dollar bounces back and flattens, with investors awaiting the preliminary Michigan consumer sentiment and inflation expectations data for May, which will be published at 14:00 GMT.
The US Dollar Index (DXY), which gauges the Greenback’s value against six major currencies, turns flat around 100.80.
Investors will pay close attention to the US Consumer Sentiment Index data, which fell to 52.2 in April due to the trade war with China. This was the lowest figure seen since July 2022.
Meanwhile, the Japanese Yen (JPY) outperforms its peers despite weak Q1 Gross Domestic Product (GDP) data. The Japanese economy contracted by 0.2% in the January-March period, while it was expected to decline by 0.1%. In the last quarter of 2024, the economy expanded at a robust pace of 0.6%.
Japanese Yen PRICE Today
The table below shows the percentage change of Japanese Yen (JPY) against listed major currencies today. Japanese Yen was the strongest against the Swiss Franc.
| USD | EUR | GBP | JPY | CAD | AUD | NZD | CHF | |
|---|---|---|---|---|---|---|---|---|
| USD | -0.07% | 0.14% | -0.12% | -0.00% | -0.10% | -0.31% | 0.25% | |
| EUR | 0.07% | 0.21% | -0.03% | 0.05% | -0.02% | -0.24% | 0.31% | |
| GBP | -0.14% | -0.21% | -0.25% | -0.15% | -0.24% | -0.44% | 0.11% | |
| JPY | 0.12% | 0.03% | 0.25% | 0.10% | -0.02% | -0.23% | 0.34% | |
| CAD | 0.00% | -0.05% | 0.15% | -0.10% | -0.12% | -0.29% | 0.25% | |
| AUD | 0.10% | 0.02% | 0.24% | 0.02% | 0.12% | -0.20% | 0.35% | |
| NZD | 0.31% | 0.24% | 0.44% | 0.23% | 0.29% | 0.20% | 0.55% | |
| CHF | -0.25% | -0.31% | -0.11% | -0.34% | -0.25% | -0.35% | -0.55% |
The heat map shows percentage changes of major currencies against each other. The base currency is picked from the left column, while the quote currency is picked from the top row. For example, if you pick the Japanese Yen from the left column and move along the horizontal line to the US Dollar, the percentage change displayed in the box will represent JPY (base)/USD (quote).
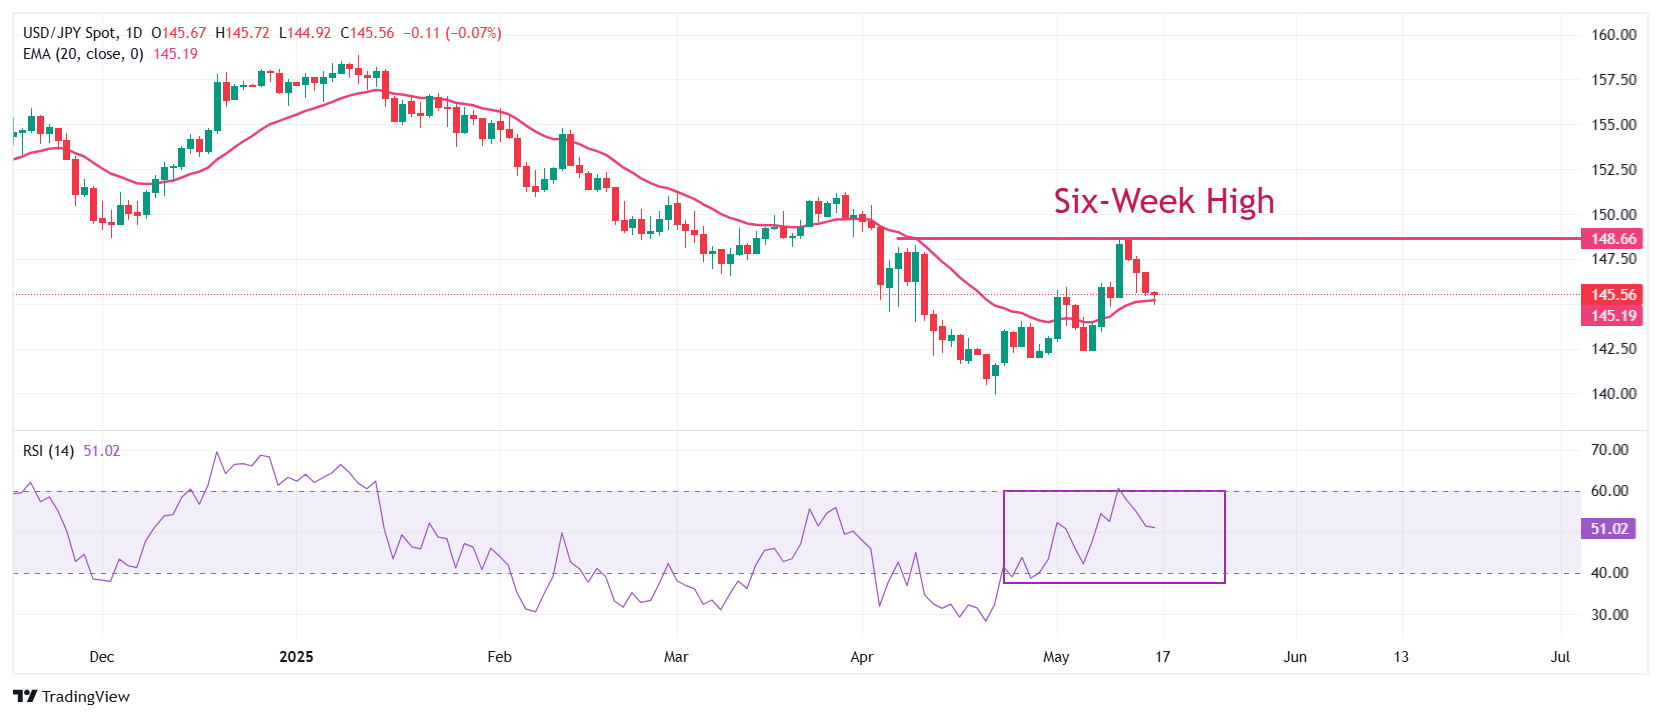
USD/JPY retraces significantly from an almost six-week high of 148.54 to near 145.00 on Friday. The 20-day Exponential Moving Average (EMA) near 145.20 continues to provide support to the pair.
The 14-day Relative Strength Index (RSI) struggles to break above 60.00. A fresh bullish momentum would trigger if the RSI falls below the 60.00 level.
An upside move in the pair towards the psychological level of 150.00 and the March 28 high of 151.21 would come if it breaks above the May 13 high of 148.57.
The asset would face more downside towards the April 22 low of 139.90 and the 14 July 2023 low of 137.25 if it breaks below the May 7 low of 142.42.
USD/JPY daily chart