- Silver price tumbles to near $32.30 on optimism about a potential trade deal between the US and China.
- This week, the US and China agreed to lower tariffs by 115%.
- Soft US economic data has weighed heavily on US Treasury yields.
Silver price (XAG/USD) falls sharply to near $32.30 during European trading hours on Friday. The white metal is down over 1% as investors become increasingly confident about a trade deal between the United States (US) and China.
The White House has signaled that Washington will “conduct a series of negotiations” with Beijing to avoid “escalation in trade tensions”. “We are going into a series of negotiations with China to prevent escalation again,” US Treasury Secretary Scott Bessent said on Thursday.
Trade tensions between the US and China started receding after both nations agreed to lower tariffs by 115% for 90 days. The event forced market experts to revise their global growth projections on the upside.
Theoretically, the demand for safe-haven assets, such as Silver, declines in a calm market mood. However, the demand for Silver as an industrial product has increased, given that China is recognized as the major manufacturing hub of the world. The temporary trade truce between the US and China is expected to allow Chinese firms to return to their prior capacity utilization. Silver as an industrial product is used in various sectors such as Electric Vehicles (EVs), electronics, and mining, etc.
The Silver price is lower despite a significant correction in US bond yields. 10-year US Treasury yields retrace sharply to near 4.40% from their monthly high of 4.55% posted on Thursday after the release of the soft US Producer Price index (PPI) and Retail Sales data for April.
Theoretically, the demand for non-yielding assets, such as the Silver price rises, when yields on interest-bearing assets decline.
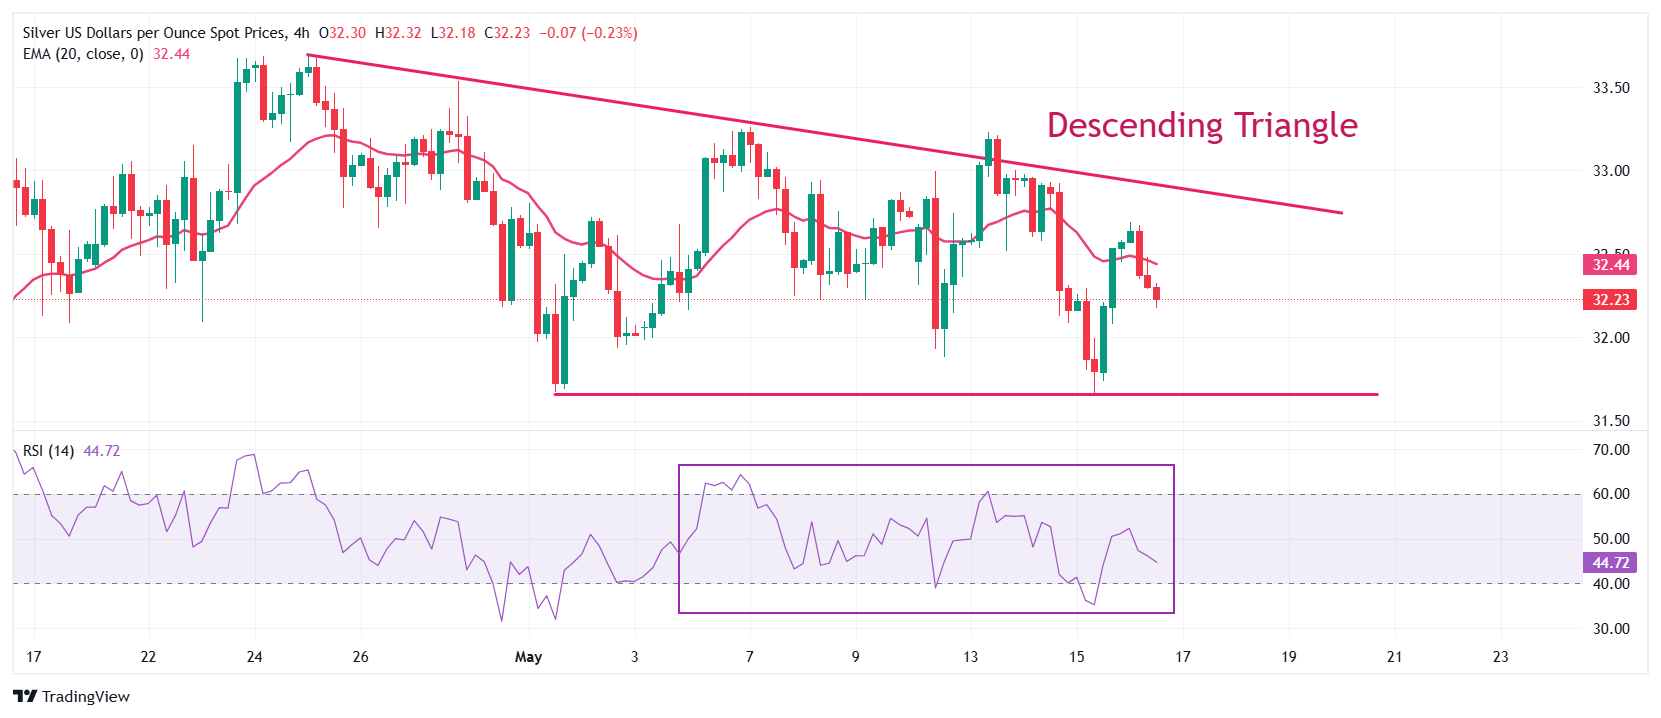
Silver technical analysis
Silver price trades in a Descending Triangle formation on a four-hour timeframe. The chart pattern reflects indecisiveness among market participants. The near-term trend of the white metal is uncertain as it wobbles around the 20-period Exponential Moving Average (EMA), which is close to $32.44.
The 14-period Relative Strength Index (RSI) oscillates inside the 40.00-60.00 range, indicating a sideways trend.
Looking up, the March 28 high of $34.60 will act as key resistance for the metal. On the downside, the April 11 low of $30.90 will be the key support zone.
Silver four-hour chart